Page 1 of 1
SView - little pointer on X & Y-axis
Posted: Wed Nov 16, 2016 3:43 pm
by dr_jones
Hi - can anyone clarify what the little pointer on the y-axis is - eg below is a lam1 trace? - you can see the pointer there on the left indicating 12.5 and on the bottom indicating 10.2...
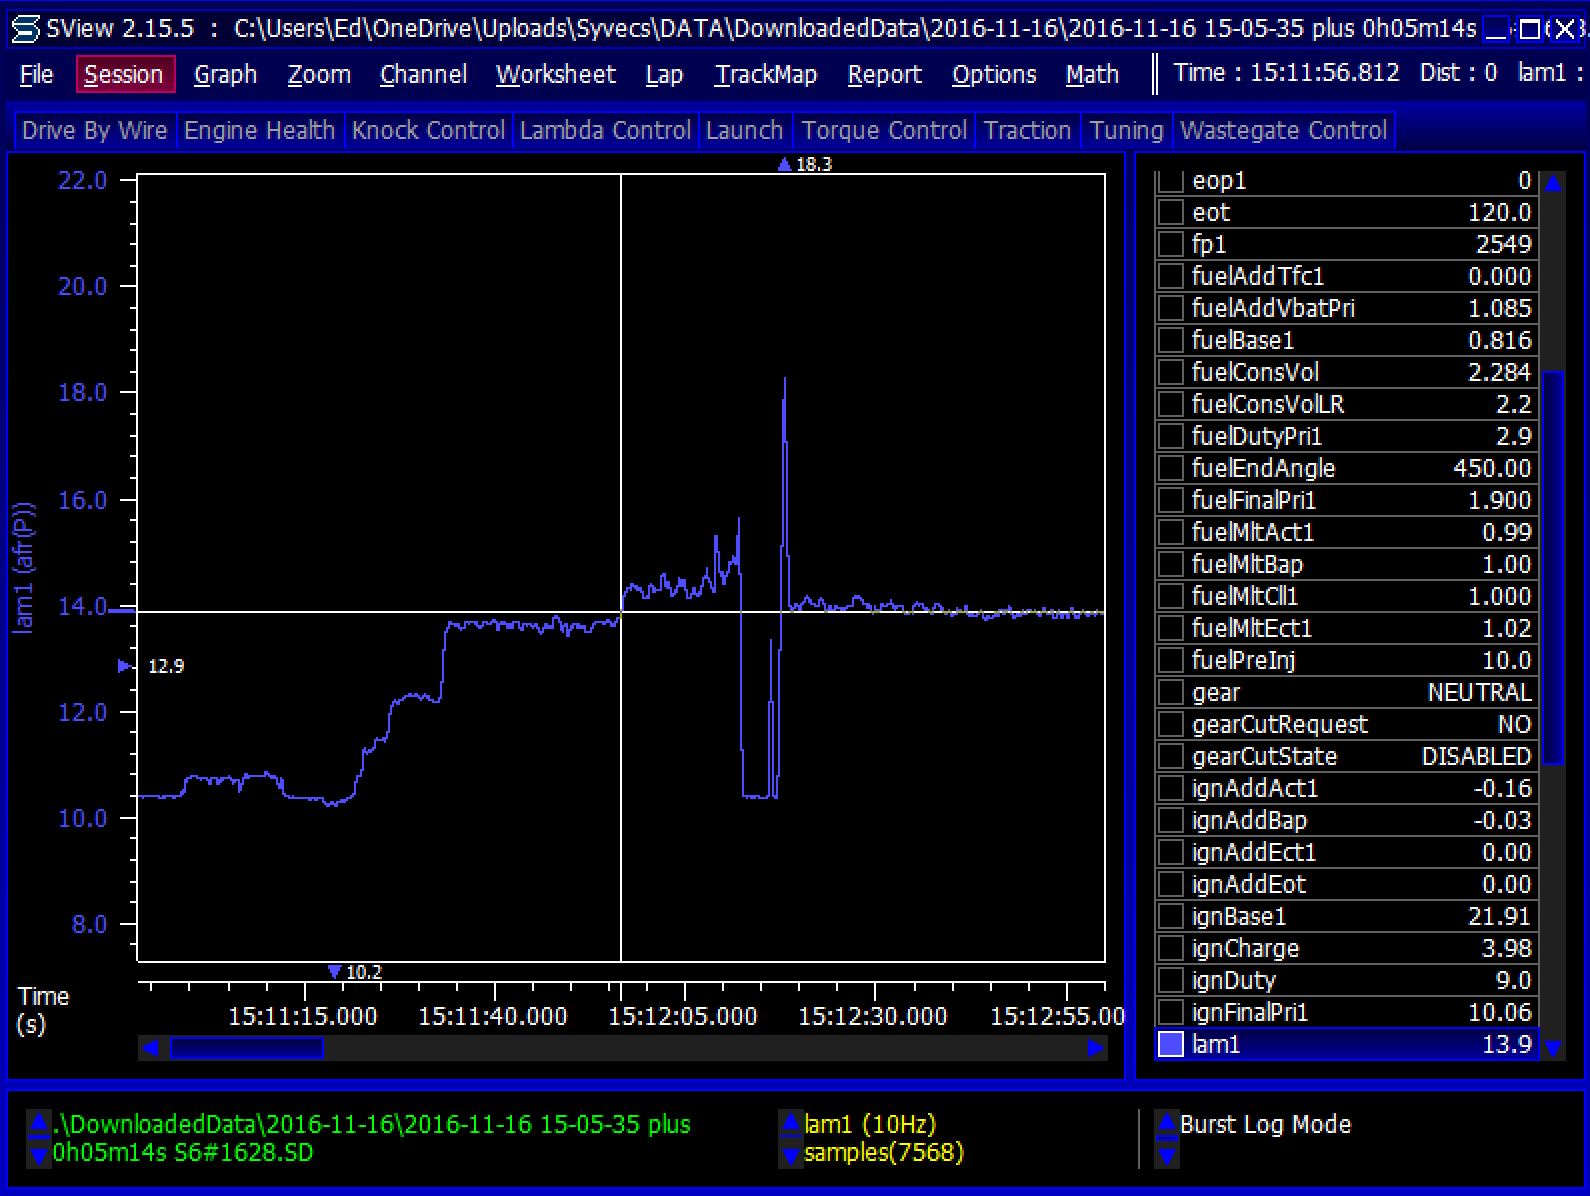
- SView_trace.JPG (273.49 KiB) Viewed 12429 times
Re: SView - little pointer on X & Y-axis
Posted: Wed Nov 16, 2016 8:25 pm
by Slowie
The blue arrow at the bottom (10.2) shows the lowest value for the selected channel, in the time series you currently have onscreen (~15:10 to 15:13 in your screenshot). The arrow at the top (18.3) shows the highest value for the selected time series, and the 12.9 on the left shows the average value for the selected channel.
Re: SView - little pointer on X & Y-axis
Posted: Wed Nov 16, 2016 9:20 pm
by dr_jones
Aha! thanks!!!